-
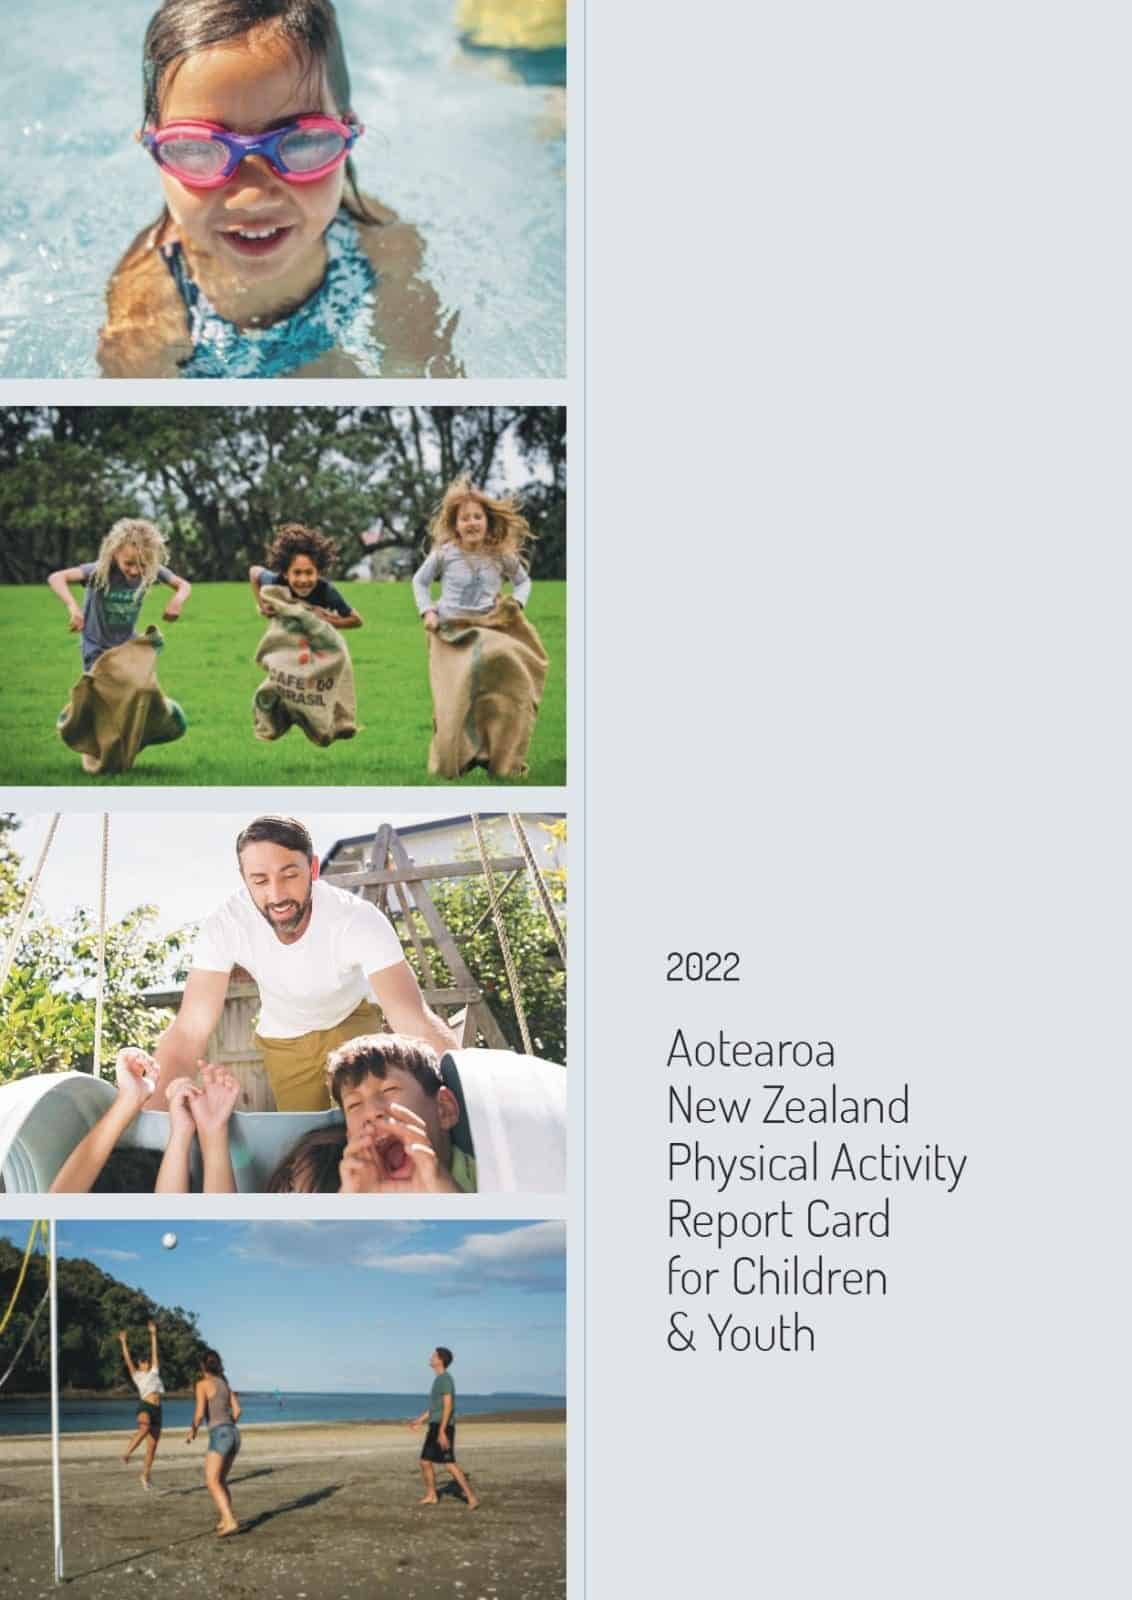
The Global Matrix 5.0
-
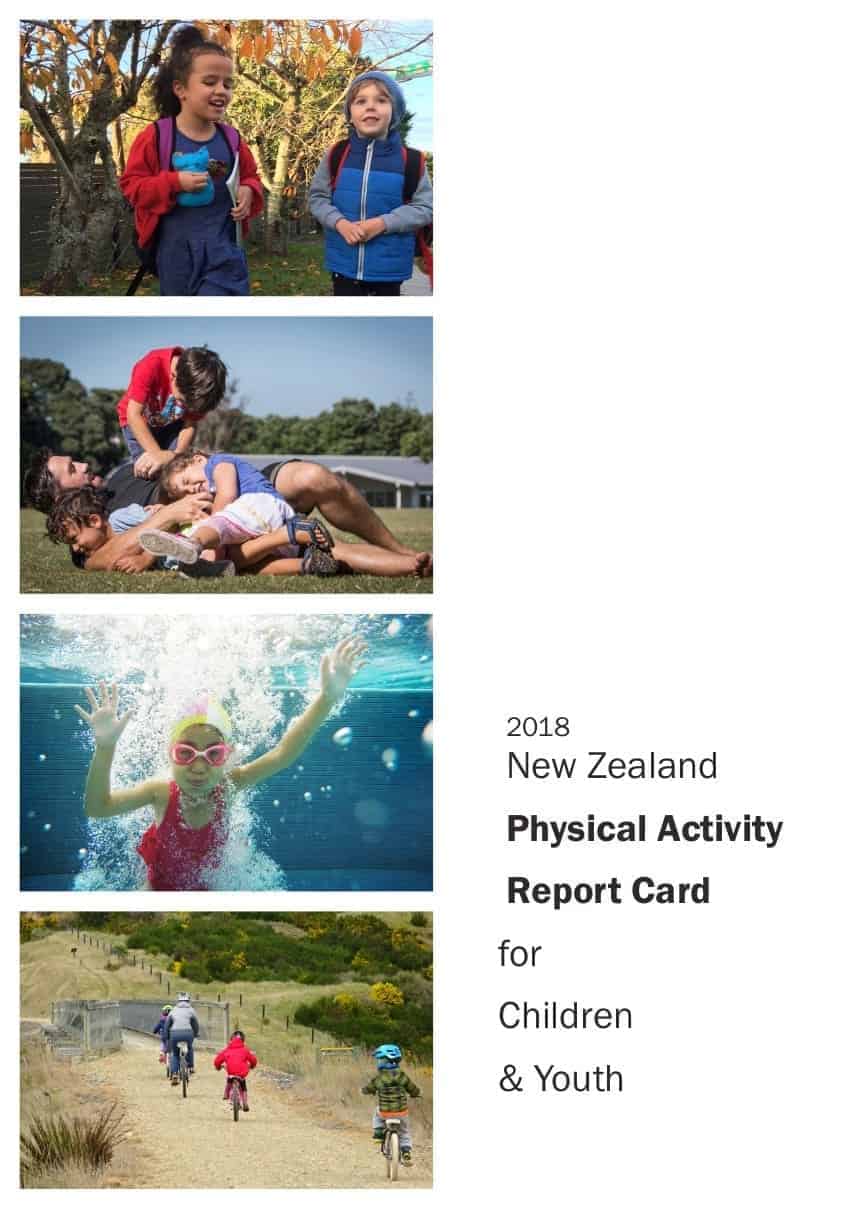
The Global Matrix 4.0
-
The Global Matrix 3.0
-
The Global Matrix 2.0
-
The Global Matrix 1.0
Report Card Leaders
Justin Richards, PH.D.
Justin Richards currently holds a dual appointment as Academic Lead at Sport New Zealand Ihi Aotearoa and Associate Professor in Physical Activity & Wellbeing at Victoria University Wellington Te Herenga Waka. His expertise is in the evaluation and surveillance of physical activity and associated wellbeing outcomes. He has been recognised for his cross-cultural research and his work with various population groups experiencing inequities globally. This includes ongoing evaluations of physical activity and sport-for-development initiatives in several low- and middle-income countries as well as various population groups in high-income settings. Justin also has experience establishing surveillance systems for non-communicable diseases in multiple countries, which has included advising the World Health Organisation (WHO) on introducing objective measures for physical activity.
Justin is passionate about practical research translation as is evidenced by his previous track record working across physical activity research (University of Oxford, University of Sydney), policy (NSW Ministry of Health, WHO, UNESCO) and practice (clinical physiotherapy, tertiary teaching). He was the founding editor of the Journal of Sport for Development (JSFD), which is an international academic journal dedicated to improving cross-disciplinary access to evidence. Justin is also co-director of Pragmatic Evaluation in Physical Activity and Health (PEPAH), a charity focused on improving the evidence-base for effective implementation of ‘real world’ physical activity initiatives globally.
Erika Ikeda, PH.D.
Erika is a multidisciplinary health scientist with an interest and expertise in physical activity, active travel, build environment and air quality. After having experience in research and practice in Japan (BSc; sport science), Aotearoa New Zealand (MHSc & PhD; physical activity) and UK (Postdoc; public health), she currently supports community sports, particulalry swimming, as Head Coach and research in physical activity as Senior Research Fellow at Victoria University Wellington in Aotearoa New Zealand.
Report Card Grades
- Overall Physical Activity: C+
- Organized Sport and Physical Activity: B-
- Active Play: INC
- Active Transportation: D
- Sedentary Behavior: C-
- Physical Fitness: INC
- Family and Peers: D
- School: C+
- Community and Environment: INC
- Government: A
Related Links
Report Card Leader
Melody Smith, Ph.D.
Aspirations for neighbourhoods where children can be independently mobile, where people can get around safely by walking and cycling, and where social and physical well-being is prioritised and facilitated are key drivers of my research. Most of this work involves the integration of objective measurement of behaviours and outcomes (e.g., accelerometry, inclinometry, GPS, GIS), as well as person-centred methods (participatory planning, online mapping).
I am fortunate to work with amazing researchers and students across a range of exciting and innovative projects that contribute to understanding the links between built and social environments and health and well-being in children and their families. I’m delighted to be working with the Aotearoa New Zealand report card team again for the Global Matrix 4.0.
More about our programme of research can be found here:
www.researchgate.net/profile/Melody_Smith11
Report Card Grades
- Overall Physical Activity: D-
- Organized Sport and Physical Activity: B
- Active Play: C+
- Active Transportation: C-
- Sedentary Behavior: D
- Physical Fitness: INC
- Family and Peers: C-
- School: B-
- Community and Environment: B
- Government: B+
Related Links
Top Three Priorities
- Develop and implement nationally representative surveys that enable the consistent and regular measurement of key Physical Activity Report Card indicators.
- Support active transportation through investment in multi-sectoral approaches including urban planning, school and community-led initiatives and social marketing campaigns.
- Promote all dimensions of physical activity (overall activity, active play, recreation, organised sport, active transport) and the reduction of screen time through policy, research, evidence-based social marketing campaigns and urban design.
Report Card Leader
Testimonial
"This is such an important activity - we know how important physically active lifestyles are for children and youth, and being able to take stock and benchmark how we are doing on a regular basis, nationally and internationally is extremely helpful to identify areas to target and advocate for change." - Melody Smith, Ph.D.
Conference Abstract: Movement to Move
New Zealand Physical Activity Card for Children and Adolescents 2018
Sandra Mandic1, Erika Ikeda2, Erica Hinckson2, Scott Duncan2, Ralph Maddison3,4, Kim Meredith-Jones5, Caroline Walker6, Melody Smith7.
1Active Living Laboratory, School of Physical Education, Sport and Exercise Sciences, University of Otago, Dunedin, New Zealand; 2School of Sport & Recreation, Auckland University of Technology, Auckland, New Zealand; 3Institute for Physical Activity and Nutrition, Deakin University, Melbourne, Australia; 4The National Institute for Health Innovation, The University of Auckland, Auckland, New Zealand; 5Department of Medicine, The University of Otago, Dunedin, New Zealand; 6The Centre for Longitudinal Research – He Ara ki Mua and Growing Up in New Zealand, The University of Auckland, Auckland, New Zealand; 7School of Nursing, The University of Auckland, Auckland, New Zealand.
Introduction: The 2016 Report Card for New Zealand indicated that physical activity (PA) participation was satisfactory in children but not in adolescents. This report presents an updated synthesis of evidence.
Methods: A panel of eight experts retrieved data from available national, regional and other data sources in 2017-2018. Nationally representative data were used whenever possible. Using predefined criteria, grades A-F and incomplete/insufficient data (INC) were assigned to each indicator to allow international benchmarking. Final grades were determined by consensus.
Results: Overall physical activity (D-) was based on the proportion of children/adolescents meeting PA guidelines (national dataset: 7%, as reported by parents; two regional accelerometer PA datasets: 38-39%). Sedentary behaviour (D) was informed by proportion of children/adolescents meeting screen time guidelines (?2 hrs/day; three national datasets: 9-61%). Sport participation (B) was determined from two national datasets (81% and 54%). Active transport (C-) was based on 24-45% of children using active transport to school (five national datasets). Grades for school (B-), community and environment (B) and government (B+) were informed by multiple national data sources. Grades for active play (C+) and family and peers (C-) were informed by national datasets and agreed on by consensus recognising the lack of specific data for these benchmarking criteria. No current national or regional physical fitness data were available.
Conclusions / Recommendations: New Zealand children and adolescents have low levels of PA and high levels of screen time. Interventions to encourage PA, active transport, active play and family and peer support, and to reduce screen time should be considered.
Table 1. New Zealand PA indicators and grades
| Indicator | 2018 Grade |
| Overall physical activity | D- |
| Organized sport participation | B |
| Active play | C+ |
| Active transportation | C- |
| Sedentary behaviours | D |
| Physical fitness | INC |
| Family and peers | C- |
| School | B- |
| Community and environment | B |
| Government | B+ |
Report Card Grades
- Overall Physical Activity: B-
- Organized Sport Participation: C+
- Active Play: B-
- Active Transportation: C
- Sedentary Behaviors: C
- Family and Peers: C
- School: C+
- Community and Built Environment: B
- Government Strategies and Investments: B-
Related Links
Recommendations
- Provide a quality Physical Education programme at school.
- Promote active transport to school and other destinations.
- Engage parents and community in promoting physical activity through schools.
- Make physical activity fun, cheap, inclusive and non-threatening.
- Create environments that encourage physical activity (such as pedestrian and cycling infrastructure).
Report Card Leader
Ralph Maddison, Ph.D.
Ralph Maddison is a Professor of Physical Activity and Health. He completed his PhD in Sport and Exercise Science from the University of Auckland and joined the National Institute for Health Innovation, University of Auckland in 2005 and his research interests include physical activity and behaviour change using novel, innovative, and theoretical based interventions in children, young people and special populations. Other research initiatives include physical activity measurement and digital technologies to improve physical activity. Ralph led the development of the 2014 New Zealand Physical Activity Report Card in collaboration with Auckland University of Technology.
Testimonial
"For me personally, involvement in this project has been very valuable to become more aware of the existing national datasets and reports that describe different physical activity indicators in New Zealand and experience the process of creating this national-level report. But the most valuable experience for me was the opportunity to connect and work together with other academics and researchers across New Zealand. I hope that this work will be a springboard for future national-level collaborations in the physical activity field in New Zealand." - Ralph Maddison, Ph.D.
Conference Abstract: 6th International Congress on Physical Activity and Public Health
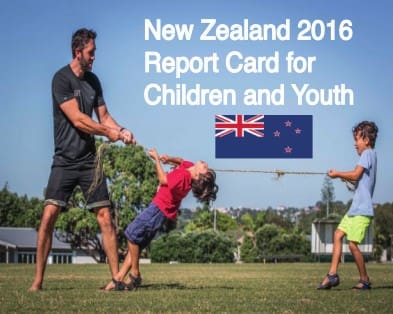
Results from the New Zealand 2016 Report Card on Physical Activity for Children and Youth
Maddison R, Marsh S, Hinckson E, Duncan S, Mandic S, Taylor R, Oliver M
Background: We report the grades for the second New Zealand Report Card on Physical Activity for Children and Youth. This 2016 report card offers a synthesis of available New Zealand evidence across nine key indicators. Methods: An expert panel of physical activity (PA) researchers from three universities collated and reviewed available nationally representative survey data between March and May 2016. In the absence of new data (2014-present), regional level data were also used to inform the direction of existing grades. Results: PA, Active Play and Government Initiatives were graded B-. Community Environments was graded B. Sport Participation and School Environment received a C+, while Sedentary Behaviours, Active Travel, and Family/Peers Support were graded C. Conclusions: Overall, PA participation in New Zealand is satisfactory but reflects higher activity levels of young children 5-9 years. The overall grade for PA decreased slightly from the 2014 report card, and reflects the low levels of PA among youth in New Zealand, particularly females.
Report Card Grades
- Overall Physical Activity: B
- Organized Sport Participation: B
- Active Play: B
- Active Transportation: C-
- Sedentary Behaviors: C
- Family and Peers: C
- School: B-
- Community and Built Environment: C
- Government Strategies and Investments: INC
Related Links
Report Card Leader
Ralph Maddison, Ph.D.
Ralph Maddison is a Professor of Physical Activity and Health. He completed his PhD in Sport and Exercise Science from the University of Auckland and joined the National Institute for Health Innovation, University of Auckland in 2005 and his research interests include physical activity and behaviour change using novel, innovative, and theoretical based interventions in children, young people and special populations. Other research initiatives include physical activity measurement and digital technologies to improve physical activity. Ralph led the development of the 2014 New Zealand Physical Activity Report Card in collaboration with Auckland University of Technology.
